Real-time BI dashboards are revolutionizing the way businesses visualize and utilize data, providing instantaneous insights that drive informed decision-making. As industries from finance to healthcare adopt these dynamic tools, the significance of real-time data visualization becomes more evident, enabling organizations to respond swiftly to market changes and operational needs.
These dashboards have evolved dramatically from their static predecessors, incorporating cutting-edge technologies that allow for seamless data integration and interactive user experiences. Businesses now rely on real-time BI dashboards to stay competitive, ensuring that they can not only monitor performance metrics but also adapt strategies based on live data.
Introduction to Real-time BI Dashboards
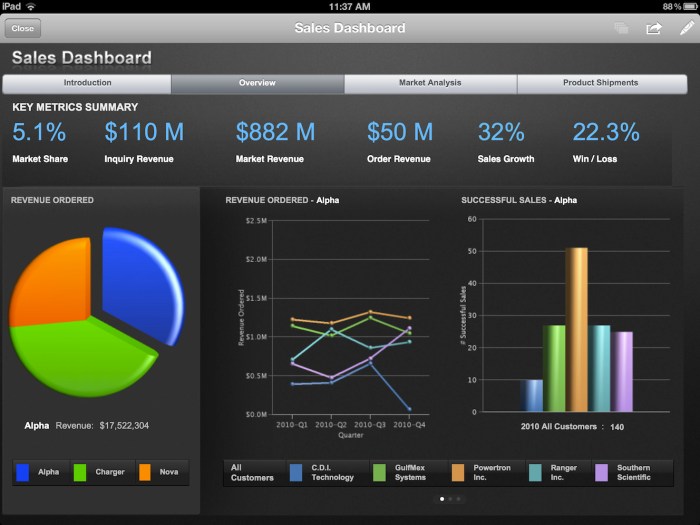
Real-time Business Intelligence (BI) dashboards represent a pivotal advancement in data visualization, enabling organizations to monitor their key performance indicators (KPIs) and metrics in real-time. The significance of these dashboards lies in their ability to provide instant insights, allowing businesses to make informed decisions quickly. Industries such as finance, healthcare, retail, and logistics reap substantial benefits from real-time BI dashboards. For instance, financial institutions utilize these dashboards to track stock prices and market trends instantaneously, while healthcare providers monitor patient data to enhance care delivery. The evolution of BI dashboards has progressed from static reports, which often became obsolete shortly after publication, to dynamic systems capable of processing and displaying real-time data, thus transforming the data landscape.
Key Features of Real-time BI Dashboards
Effective real-time BI dashboards are characterized by several essential features that enhance their usability and effectiveness. These features include:
- Real-time Data Processing: The ability to process and visualize data as it is generated ensures that decision-makers have access to the most current information available.
- Interactivity: Users can interact with the data, filtering and drilling down into details, which fosters a deeper understanding of the metrics.
- User Customization: Dashboards should offer customization options, allowing users to tailor the information displayed according to their specific needs.
- Mobile Accessibility: Modern dashboards must be accessible via mobile devices, enabling users to access critical data on-the-go.
- Alerts and Notifications: Built-in alert systems notify users of significant changes or anomalies in the data, prompting timely interventions.
The significance of interactivity and user customization cannot be overstated, as they empower users to derive insights that are relevant to their unique business context. Technologies such as cloud computing, big data analytics, and advanced visualization tools like D3.js and Tableau underpin the capabilities of real-time BI dashboards, supporting quick data processing and rich graphical presentations.
Benefits of Implementing Real-time BI Dashboards
Utilizing real-time BI dashboards offers numerous advantages that can significantly enhance decision-making processes within organizations. These benefits include:
- Enhanced Decision-Making: Access to real-time data allows leaders to make informed decisions promptly, reducing the risk of missed opportunities.
- Improved Operational Efficiency: Real-time insights help identify bottlenecks and inefficiencies in processes, facilitating rapid corrections and streamlining operations.
- Increased Customer Satisfaction: Organizations can respond to customer needs effectively, using real-time data to tailor services and improve engagement.
Real-time data’s impact on customer satisfaction is profound, as it enables businesses to understand customer behaviors and preferences instantaneously, leading to more personalized service offerings.
Challenges in Developing Real-time BI Dashboards
The development of real-time BI dashboards is not without its challenges, which can hinder their effectiveness. Common obstacles include:
- Data Integration Issues: Consolidating data from various sources can pose significant challenges, often resulting in inconsistencies and delays.
- Maintaining Data Accuracy: Ensuring that data remains accurate and up-to-date is critical for the effectiveness of real-time dashboards.
- Scalability: As organizations grow, their data needs may expand, requiring dashboards to scale accordingly without compromising performance.
Strategies to overcome these challenges include adopting robust data governance practices, leveraging middleware solutions for integration, and implementing automated data validation processes.
Designing Effective Real-time BI Dashboards

Creating effective real-time BI dashboards necessitates careful consideration of data presentation and visual design principles. Key guidelines include:
- Clear Hierarchy: Organize information in a manner that highlights the most essential metrics first, making it easier for users to discern critical insights.
- Consistent Visual Elements: Use consistent colors, fonts, and styles to enhance readability and user experience.
- Responsive Layout: Ensure that the dashboard adapts to different screen sizes, maintaining usability across devices.
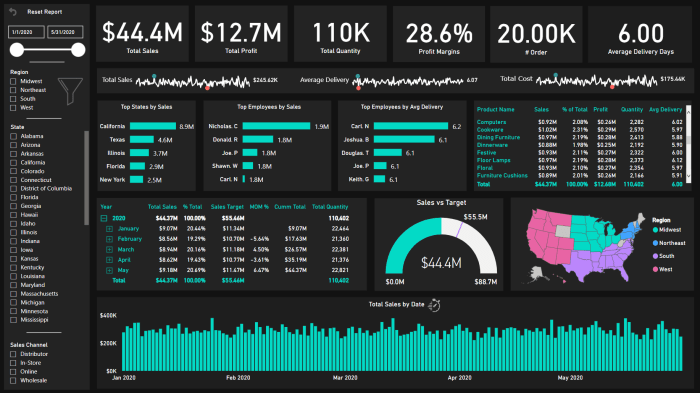
A mockup example of a real-time BI dashboard could include a structured layout using HTML table tags. The table might consist of responsive columns displaying KPIs such as sales figures, customer interactions, and operational metrics, arranged for clarity and impact.
Tools and Technologies for Real-time BI Dashboards
A variety of tools facilitate the creation of real-time BI dashboards, each offering distinct features that cater to different organizational needs. Popular tools include:
- Tableau: Known for its powerful visualization capabilities, Tableau allows users to create interactive dashboards with ease.
- Power BI: Microsoft’s Power BI integrates seamlessly with other Microsoft products, providing comprehensive data analysis tools.
- Qlik Sense: Qlik Sense offers associative data modeling, enabling users to explore data relationships dynamically.
The role of cloud computing is crucial, as it enhances dashboard capabilities by providing scalable resources for data storage and processing. Additionally, the integration of AI and machine learning into BI dashboards is becoming increasingly important, allowing for predictive analytics and smarter decision-making.
Use Cases of Real-time BI Dashboards
Real-time BI dashboards are implemented in various scenarios, demonstrating their versatility and effectiveness. Specific use cases include:
- Retail Inventory Management: Retailers utilize dashboards to monitor stock levels and sales data in real-time, enabling efficient inventory management.
- Healthcare Monitoring: Hospitals track patient metrics in real-time, allowing for immediate responses to changes in patient conditions.
- Financial Trading: Traders rely on dashboards to monitor market fluctuations, aiding in swift investment decisions.
Case studies of organizations that successfully implemented real-time BI dashboards highlight significant improvements in operational efficiency and decision-making speed. Metrics typically monitored span customer satisfaction scores, sales growth rates, and operational KPIs.
Future Trends in Real-time BI Dashboards
Looking ahead, several trends are poised to shape the future of real-time BI dashboard technology. Predictions for development include:
- Increased Automation: Automation of data collection and report generation will reduce manual intervention, enhancing efficiency.
- Enhanced User Experience: Future dashboards may incorporate advanced user interfaces that leverage natural language processing for more intuitive interactions.
- Integration of Augmented Reality (AR): AR may play a role in visualizing data in immersive ways, offering a new dimension to data interaction.
Emerging technologies such as blockchain for data integrity and advanced AI algorithms for data analysis will likely influence real-time BI dashboards, driving innovation and improved user insights.
Final Conclusion: Real-time BI Dashboards
In conclusion, the implementation of real-time BI dashboards represents a pivotal shift in data management and visualization. As organizations continue to harness real-time data for strategic advantage, understanding the challenges and future trends will be crucial for maximizing their potential. Embracing these technologies not only fosters enhanced operational efficiency but also significantly boosts customer satisfaction through timely insights and responsive actions.